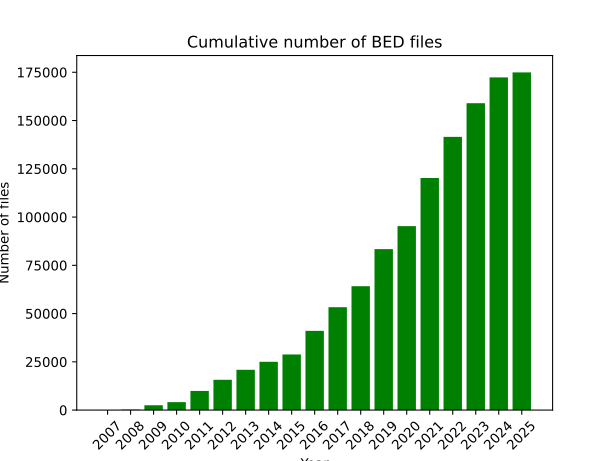
Plot total number of bed files in GEO database.
All GEO bed files are related to GSM (samples) and samples are related to GSE (series).
All projects (series) are downloaded and served in PEPhub: https://pephub.databio.org/bedbase.
So the easiest way to count total number of bed files in
GEO is to count the number of samples under bedbase namespace.
Important to note, that one sample can have multiple project, that's why we need to count distinct samples.
To do so we can use sql query:
select EXTRACT(YEAR FROM b.submission_date) AS year, count(distinct a.sample_name) from samples as a join projects as b on a.project_id = b.id where b.namespace='bedbase' group by EXTRACT(YEAR FROM b.submission_date) order by year;It is a heavy query, that will take a while to run. (up to 3 minutes)
This will give you the number of samples per year. e.g.
year count2007 472008 1972009 22602010 16082011 58002012 57962013 51542014 41452015 38002016 122422017 122382018 108762019 192272020 118862021 249662022 212802023 174582024 133482025 2602After you have a csv with the number of samples per year, you can use it to plot the number of samples per year.
import pandas as pdimport matplotlib.pyplot as plt
data = pd.read_csv("geo2025_06.csv")
data["summary"] = data["count"].cumsum()data["year_str"] = data["year"].astype(str)

fig, ax = plt.subplots()plt.xticks(rotation=45)ax.bar(data["year_str"], data["summary"], label=data["year_str"], color="green")
ax.set_xlabel("Year")ax.set_ylabel("Number of files")ax.set_title("Cumulative number of BED files")

fig.savefig("./bed_geo_2025_06_summary.svg")
The output plot:
Section titled “The output plot:”